

Description
Workflow
Use Echoview to process your hydroacoustic data according to a logical workflow:
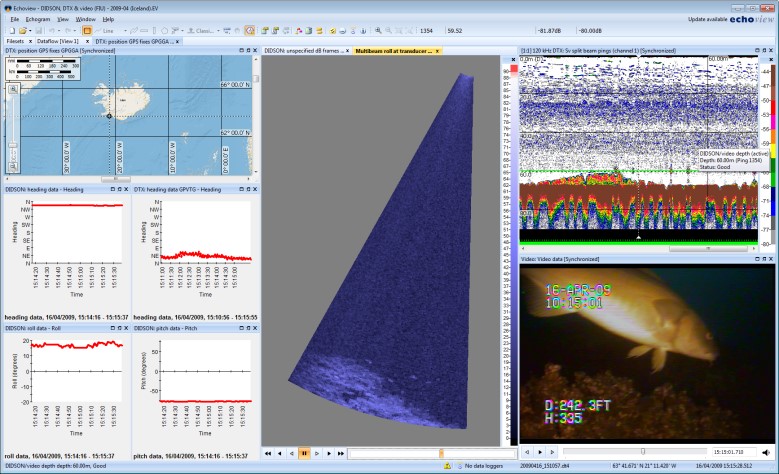
- Explore Visualize and explore your acoustic and ancillary data in the form of echograms, maps, graphs, tables and 4D scenes.
- Calibrate Convert your raw acoustic data into absolute measurements of backscatter that are correctly positioned in space and time.
- Clean Identify and mitigate background noise, intermittent noise, missing data and other unwanted components.
- Detect Define the bottom depth, detect individual targets, schools or other aggregations, track target movement over multiple pings and partition your data however you choose.
- Classify Perform absolute and probabilistic single- and multi-frequency echo-trace classification.
- Characterize Calculate and export analyses for extensive data characterization and for further analysis of your acoustic data products with your choice of third-party software.
- Automate Save your dataflow for application to other datasets, and write scripts (instructions for Echoview) in your preferred programming language.
[show_more more=”Read more…” less=”Read less…”]
Stock Assessment
Stock assessments are critical for the management of marine and freshwater resources. Echoview provides an unrivalled wealth of powerful yet
easy-to-use tools for quantitative acoustics.
As the industry standard, Echoview allows you to:
- Explore and calibrate your data
- Account for noise and other artifacts that affect biomass estimates
- Detect schools of fish or zooplankton
- Calculate the bottom depth
- Classify your data (e.g. for species identification) manually or based on user-defined rules
- Characterize your processed data using an extensive range of analysis variables.
Behavior & Ecology
Echosounder and sonar data can provide unrivalled spatial and temporal information at the level of individuals (e.g. fish, krill), aggregations (e.g. schools, layers) and intervals (in space and/or time). Echoview provides a wealth of powerful yet easy-to-use tools, algorithms and operators for identifying and characterizing these levels in your acoustic data.
As the world’s most comprehensive, flexible and trusted tool for bioacoustic data processing, Echoview enables you to:
- Detect and track individual organisms
- Estimate fish size
- Detect school aggregations
- Delineate your data in space and/or time
- Visualize and synchronize acoustic and video data
- Characterize individuals, aggregations and intervals in terms of their location, morphometry, acoustic energy and environment.
Habitat Classification
Echosounder backscatter measurements of the bottom (whether seabed, lake bottom or riverbed) can provide information about the nature of that substrate (e.g. hard or soft, rough or smooth, sand or gravel) and its bathymetry.
Echoview provides a convenient yet powerful way to objectively describe the bottom and help to understand its role as habitat for aquatic organisms using data from single- and split-beam echosounders by enabling you to:
- Explore and calibrate your data
- Account for noise and other artifacts
- Define the bottom depth
- Visualize and synchronize acoustic and video data
- Identify and characterize the first and second bottom echoes
- Quantify and simplify the variance in the bottom features by Principal Component Analysis
- Cluster bottom points into classes by k-means clustering.
Contact Information
Tim Chalke
Email: sales@echoview.com
Phone: (036) 231-5588
[/show_more]